Contact Us
Data Visualization Services
Accurate Strategies from High Impact Visual Stories
Converting fragmented data into accurate visual stories, enabling professionals to identify trends, patterns and precise decision making for driving consistent growth in the dynamic market.
Talk to Our Experts15+
Years of Industry Experience
1,100+
Successfully Delivered Projects
250+
Global Clients
150+
Full-time Data Specialists
Tailored to Your Requirements
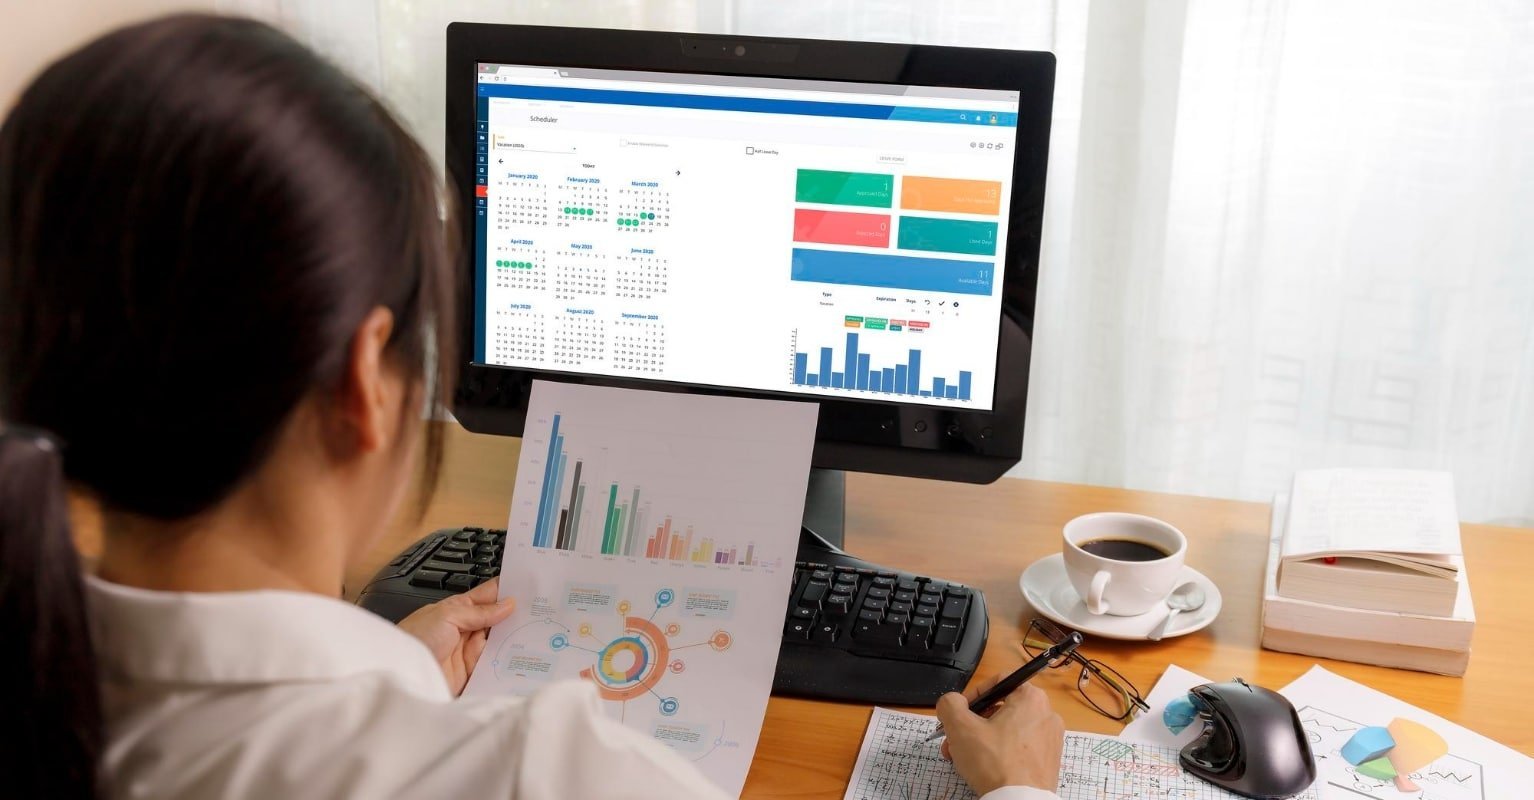
Data is a valuable resource as it offers comprehensive insights for business decision making. At UniquesData, we go beyond simple charts, creating immersive data environments that ensure to interact with business metrics in real time.
Interactive storytelling
We build dynamic data narratives that seamlessly guide users from high-level executive overviews down to the most granular details, turning static numbers into an engaging, logical journey.

KPI tracking
Utilizing custom-designed choropleth maps, scatter plots, and multi-variable trend lines to continuously monitor and alert leadership on your most critical business performance drivers.
Automated Reporting
Completely eliminate time-consuming manual data entry and human error with scheduled, automated visual updates that pull directly from live enterprise databases in real-time.

Geospatial Mapping
Intelligently visualizing complex location-based data to optimize supply chain logistics, balance sales territories, and unlock hidden regional performance opportunities.

Executive Scorecards
Delivering simplified, high-impact visual dashboards designed specifically for rapid decision-making, ensuring c-suite leaders can assess organizational health at a single glance.

Don't let your data be in spreadsheets only
Unlock hidden patterns in your business with visualization that speak louder than numbers. Our team is ready to transform your raw datasets into competitive insights for business growth.
Get a Quick CallHow It Works

Discovery and Objective Definition
Collaborate with business leaders to identify core organizational objectives and locate hidden analytical pain points. Define the specific target audience, delivery formats, and visual requirements necessary to ensure the final assets achieve simplified communication.
Data Aggregation and Quality Assessment
Extract and compile disparate data streams from isolated cloud servers, spreadsheets, or internal databases. Run initial data profile audits to clean, normalize, and structurally prepare raw variables, ensuring high structural integrity before graphical analysis begins.

Exploratory Analysis and Pattern Recognition
Conduct deep mathematical exploration using statistical distributions and preliminary charting techniques to uncover hidden data behaviors. Isolate anomalies, identify shifting variables, and chart deep historical trends to unlock advanced pattern recognition capabilities.

Visual Architecture and Graphic Design
Convert complex data relationships into intuitive, high-impact graphical formats. Apply strict design hierarchies, precise color coding, and interactive filtering to distill dense metrics into an instantly readable format that drives improved insight.

Usability Validation and Interface Deployment
Review the graphical layouts against executive user stories to verify that the charts are easy to interpret and completely error-free. Deploy the live, interactive data visualizations directly into corporate presentation decks, internal wikis, or decision portals to immediately spark data-driven execution.
Why Choose UniquesData
01
Scalable Workforce
A dedicated team of 100+ researchers for large scale migrations.
02
Cost Control
Saving upto 60% on operational cost compared to in house data collection teams.
03
Data Privacy
Strict NDA protocols and ISO certified security to keep sensitive data safe.
04
Precision and Efficiency
Our multi-layered validation process guarantees that the information you receive is accurate.
Industrial Expertise
We serve high-compliance sectors that demand absolute data integrity

Healthcare
The healthcare industry demands actionable insights through interactive dashboards for patient wait times, bed occupancy rates, and treatment efficacy. UniquesData provides a holistic approach for the healthcare industry to accurately and efficiently manage sensitive data of medical records.

Banking
Data helps the banking and finance industry stay up to date on current market scenarios, trends, and practices. UniquesData offers accurate data structure, secured database, and ease of access of information with security control.

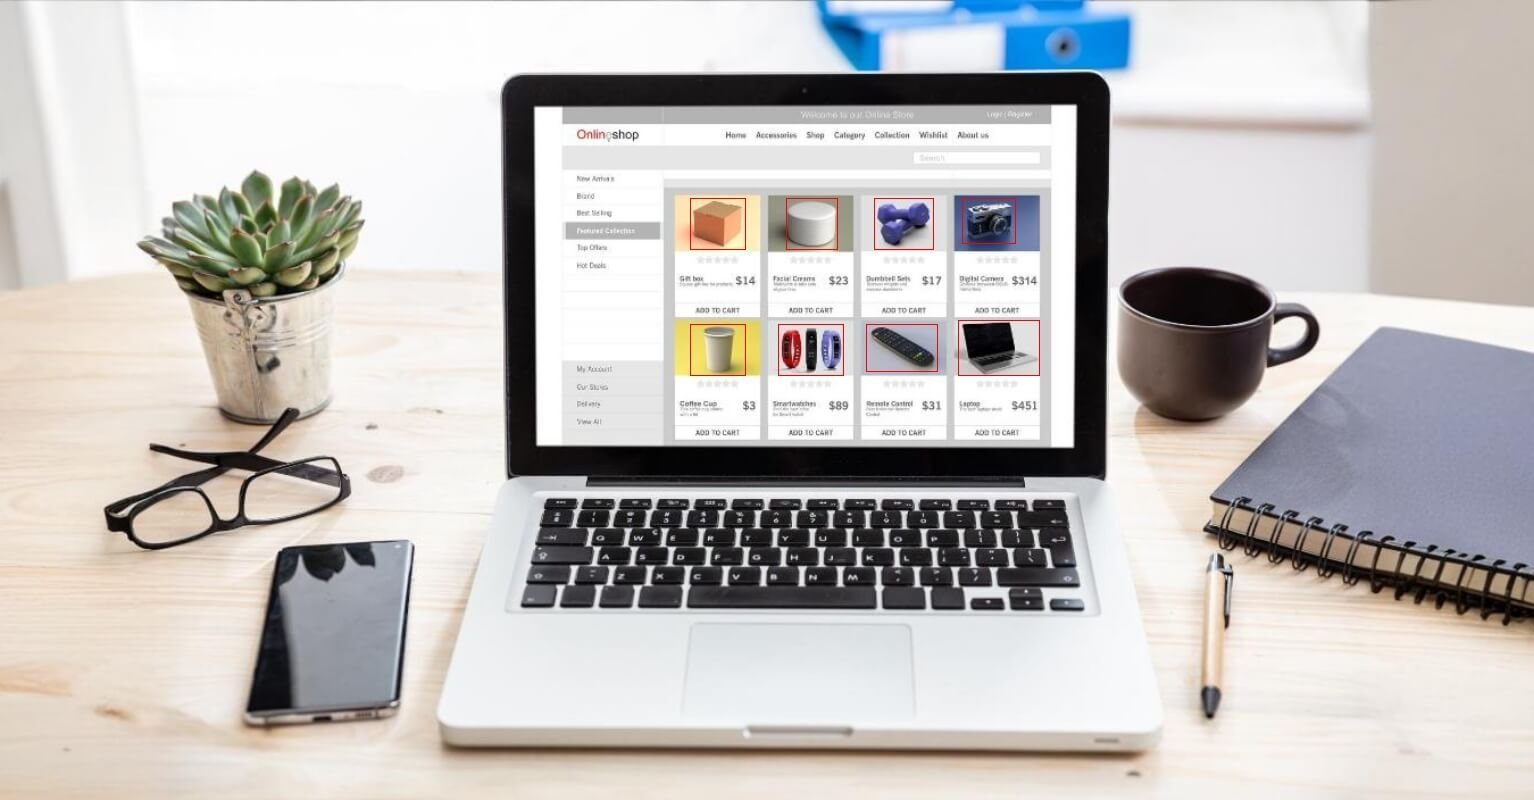
Ecommerce
e-commerce business has resulted in more data production, evident for effective results. Visualizing Customer Lifetime Value (CLV), churn prediction, and heatmaps for seasonal purchasing trends.

Insurance
Insurance digitization and processing services allows professionals to manage, store, and format the data uniformly for easy access, informed decisions and delivering customer friendly products.

Legal
Legal entity data management in law firms focuses on the core role, having well-organized data, and streamline daily operations. UniquesData aims to bring power BI solutions that offer tracking attorney utilization rates, case lifecycle duration, and realization rates.

Logistics
Digitization of logistics documents and transportation back office support tasks decrease the operational cost. UniquesData professional power BI solutions offer Last-mile delivery tracking, fuel consumption analytics, and warehouse capacity heatmaps.

Education
We bridge the gap between raw information and institutional strategy. we transform disparate education datasets into centralized, interactive dashboards, providing faculty and administrators with the clarity needed to optimize student performance and streamline institutional operations.

Real estate
Managing different aspects of data is one of the head-scratching tasks for real estate professionals. UniquesData offers precision in real estate data analytics with a talented team and technology use.

Travel and Hospitality
UniquesData offers extensive booking pace reports, seasonal demand forecasting, and guest sentiment analysis from reviews for the travel and hospitality industry by a team of experienced professionals using cutting-edge technology at affordable pricing.
FAQ

What is the difference between a report and a data visualization?
Reports are often static and heavy with text while data visualization is interactive using graphical elements to make complex trends instantly recognizable.
Can you handle unstructured data for visualization?
Yes, our team of experts first process and structure your data through ETL pipelines before any visual layer.
Will my data visualization work with my existing software?
With most modern tools like Power BI and Tableau offer embedding capabilities allowing to integrate visuals directly into the existing software or portals.
How do you ensure visualization isn't cluttered?
We follow strict data protection and UI/UX principles using progressive disclosure for users to see information at any given time.
Can we set up alerts based on certain data thresholds?
We can configure your dashboards to notify or change visual states when specific goals are missed.
Do you support big data visualization?
Yes we use optimized data modeling and specialized tools designed to handle millions of rows without compromising the speed of the visual interface.
What is data visualization and why is it important?
Data visualization is the graphic representation of data using visual elements like charts, graphs and maps to make complex information easier to understand, making it significant because it allows processing large amounts of data quickly.
What are the best tools for data visualization?
The industry leading tools for business is Microsoft Power BI, and tableau however for web based customized like Qlik, Looker Studio and programming libraries and more.
What is the difference between data analytics and data visualization?
Data analytics is an overarching process of collecting, cleaning and analyzing raw data to extract meaningful insights, identify trends and make predication. Data visualization is a component of that process acting as the visual medium used to present.
What are the different types of data visualization charts?
Common chart types include bar charts and line graphs for comparing categories and showing trends over time, alongside pie charts for displaying parts of a whole. More advanced options include scatter plots for showing correlations between variables and visualizing data density.
How does data visualization help businesses?
Data visualization helps businesses by transforming complex operational data into actionable insights that accelerates and improve decision making, enhancing cross departmental communication.